Linear Regression in Machine Learning
In this article, I will delve into the concept of Simple Linear Regression, a modeling technique that proves versatile in capturing various relationships between two variables.

What is Linear Regression?
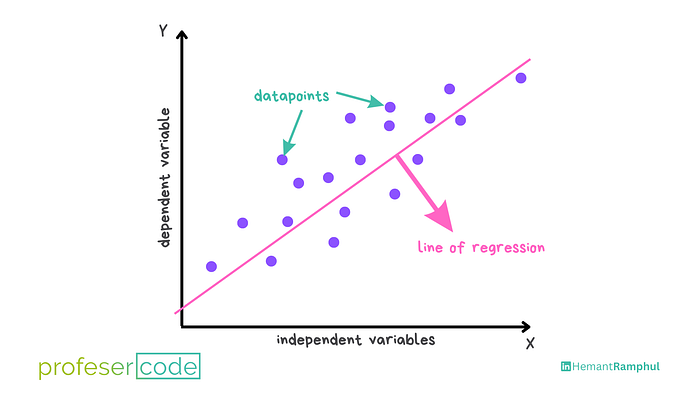
Linear regression is a fundamental machine learning algorithm used for predicting a continuous outcome variable (also called the dependent variable) based on one or more predictor variables (independent variables). The goal of linear regression is to find the best-fitting linear relationship between the input features and the output variable.

Simple Linear Regression
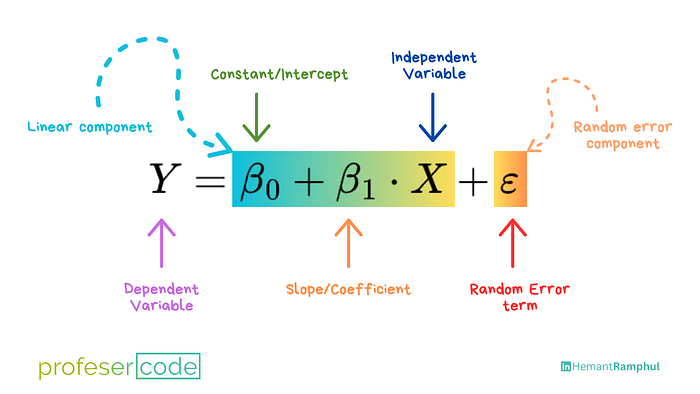
In simple linear regression, there is only one predictor variable. The relationship between the predictor variable X and the response variable Y is represented by the equation of a straight line:


where:
- Y is the dependent variable (response),
- X is the independent variable (predictor),
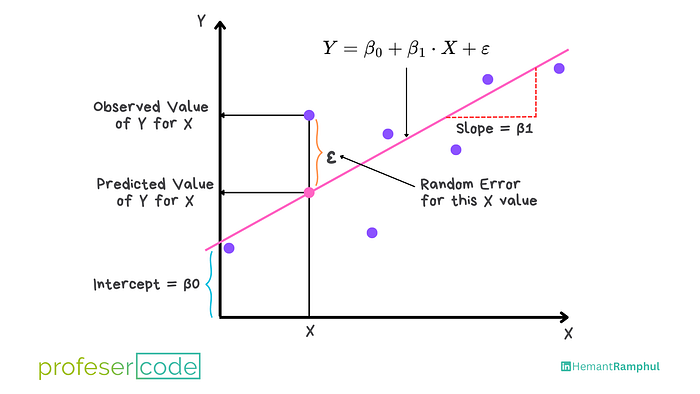
- β0 is the y-intercept,
- β1 is the slope of the line, and
- ε represents the error term.

The goal is to find the values of β0 and β1 that minimize the sum of squared errors (the vertical distances between the actual and predicted values).
There are two types of linear models: simple and multiple linear models, distinguished by the number of independent variables they involve. Simple linear models feature only one independent variable, while multiple linear models incorporate more than one.
A regression line can show a positive linear relationship, a negative linear relationship, or no relationship.

- Positive Relationship
● Upward-sloping regression line.
● Starts at y-intercept, extends upward.
● Signifies a positive linear correlation: as one variable increases, the other also increases. - Negative Relationship
● Downward-sloping regression line.
● Starts at y-intercept, extends downward.
● Indicates a negative linear correlation: as one variable increases, the other decreases. - No Relationship:
● Graphed line is flat.
● Indicates no correlation between variables.
Example with Simple Linear Regression
In this section, we will create a Simple Linear Regression model to determine the optimal line that represents the relationship between these two variables.
To implement the Simple Linear Regression model in machine learning using Python, the following steps should be followed:
- Data Collection: Gather a dataset with paired values of X and Y.
- Scatter Plot: Visualize the relationship with a scatter plot.
- Model Construction: Formulate the linear regression equation.
- Parameter Estimation: Use statistical methods (such as least squares) to find the best-fitting line.
- Model Evaluation: Assess the model’s goodness of fit using metrics like Mean Squared Error or R-squared.
Interpretation:
- The slope (β1) indicates the strength and direction of the relationship.
- The y-intercept (β0) represents the predicted value of Y when X is zero (may not be meaningful in all contexts).
No comments:
Post a Comment
Note: only a member of this blog may post a comment.